At the Top of the Chart Page
– Headline
Subhead
Same as on the chart.
Connecting Chart to Topics
Example: (For more information, see the Topics Gay Men, HIV & AIDS, STD)
Sub-Topic
The Chart
The chart is a JPEG of the screenshot of the Chart in the PDF.
Before the screenshot is created, the the 1. 2. 3. points are highlighted. Subpoints are a. b. c. and they are not highlighted.
Bar colors: “Colors for each bar within a numbered section of the chart are the same and alternate Blue/Orange between the numbered sections.”
Chart Title
Heading: A short summary of the study. Year added from study if it is pertinent to the study. For example, Trends for 2020. Since the year is important, it is added to the headline.
Subhead: The headline should have the following elements
- Short summary of the study/poll/survey
- Year of study/poll/survey or year study/poll/survey was published
- Who commissioned the study – or where it was published
- Number of participants/respondents
- Breakdown of Gender – if there is no breakdown, add (no gender/sex specified)
- Breakdown of other stats like sexual orientation
Under the Chart
Source is added with a link in the URL where the study/poll/survey was found online.
Methodology added and any other information useful to the chart from the source.
At the End of the Page
Note added when the chart was published by SexEd
Example: Chart created and posted by SexEd.net November 2020
Connecting Charts to Topics Pages (see image as example)
The charts are placed above the Introduction to the Topic and separated by asterisks * * *
Header is bold and Italicized. Both the Header/Subhead are Italicized and linked to Chart.
The image is linked to chart.
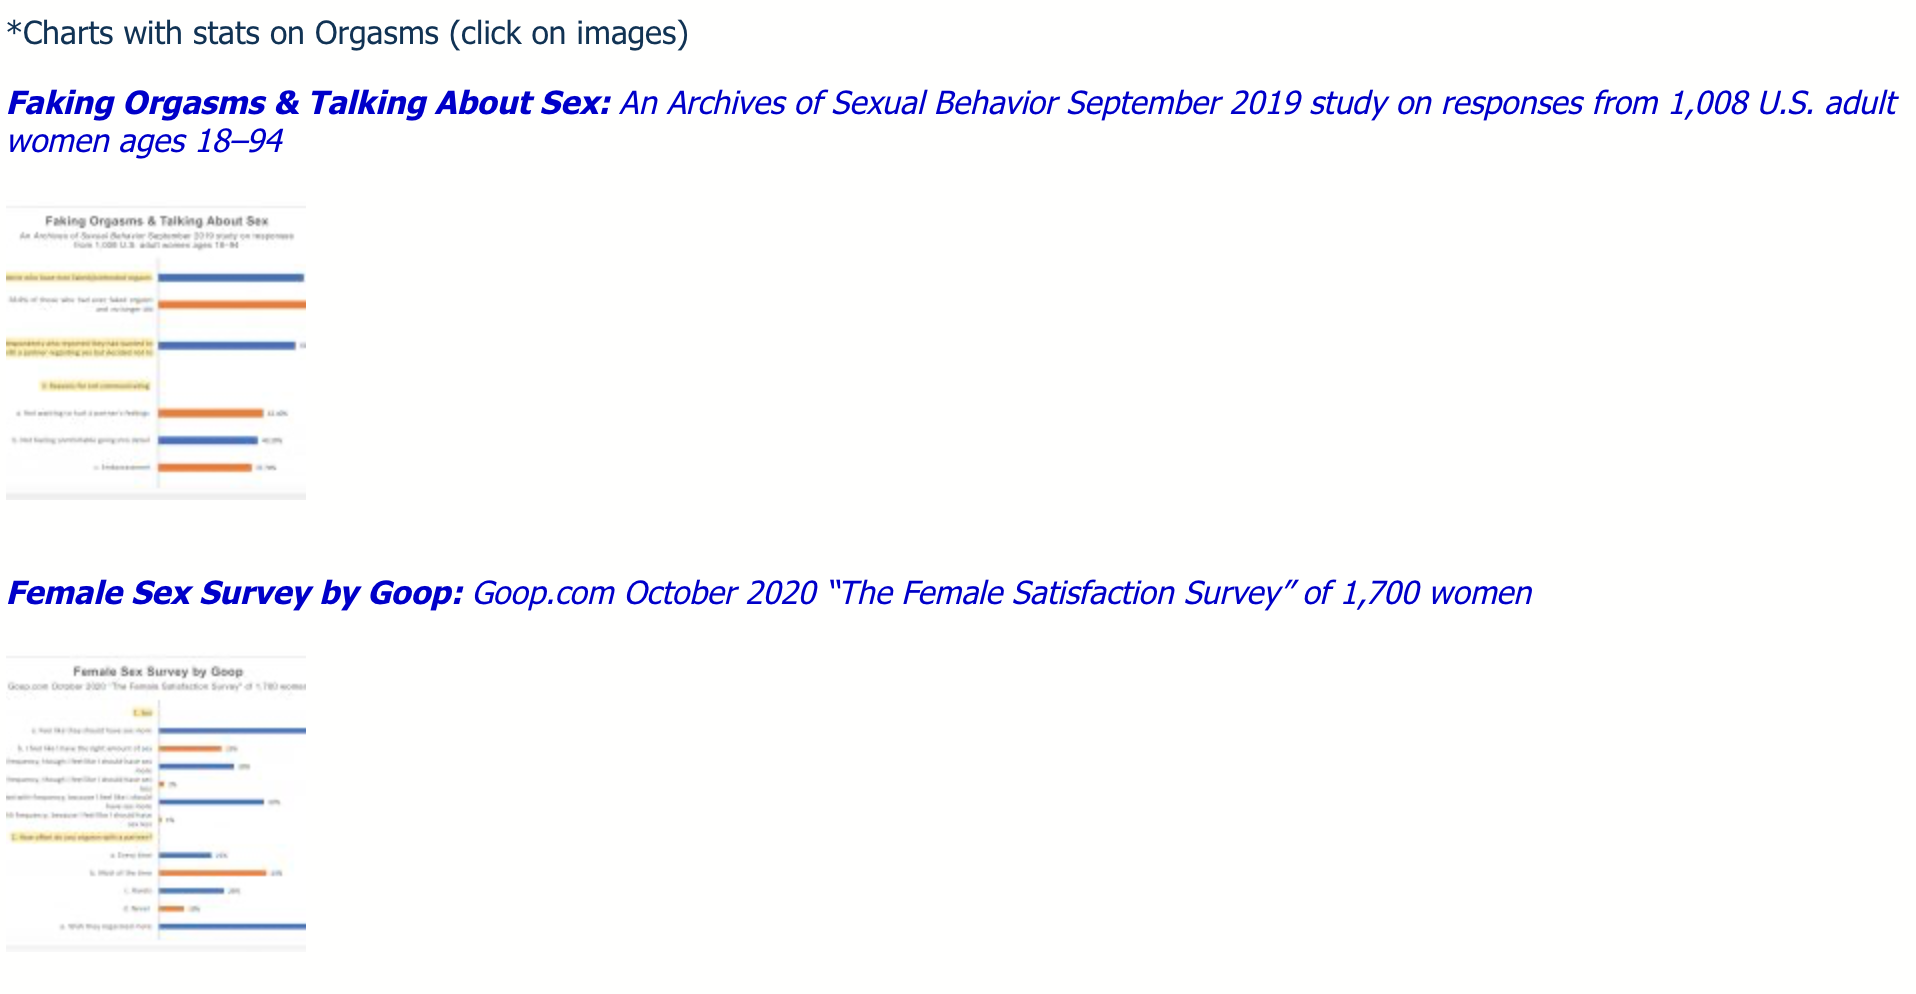
*Charts with stats on TOPIC (click on images)
*Chart with stats on TOPIC (click on image)