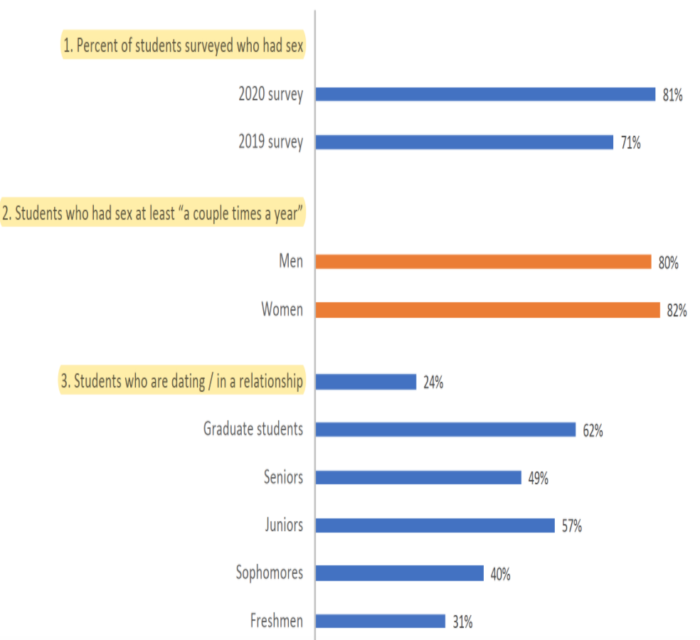
1. Stat #10 (of 11) from this study is the only section on Dating & Sex: Ohio State University – 2020 Sex Survey: The 1870 Magazine February 2020 sex survey of 1,217 Ohio State University students (58.8% women, 39.2% men, 1.5% non-binary, <1% transgender, 79.3% straight, 11.9% bisexual, 5.4% gay/lesbian, 2.3% queer/questioning, 1% other, 19% freshmen, 18.4% sophomores, 21.9% juniors, 28.2% seniors, 12.5% graduate students)

2. Stat #3 (of 4) from this study is the only section on Dating & Sex: Washington University in St. Louis – 2019 Sex Survey: Student Life independent newspaper of Washington University in St. Louis February 2019 sex survey of 2,027 students (60% cisgender female, 37% cisgender male, 1% genderqueer, 75% heterosexual, 5% gay, 12% bisexual, 2% asexual, 5% questioning)

