1. Stat #6 (of 11) from this study is the only section on Sex Toys: Ohio State University – 2020 Sex Survey: The 1870 Magazine February 2020 sex survey of 1,217 Ohio State University students (58.8% women, 39.2% men, 1.5% non-binary, <1% transgender, 79.3% straight, 11.9% bisexual, 5.4% gay/lesbian, 2.3% queer/questioning, 1% other, 19% freshmen, 18.4% sophomores, 21.9% juniors, 28.2% seniors, 12.5% graduate students)

2. Stat #5 (of 9) from this study is the only section on Sex Toys: Ohio State University – 2019 Sex Survey: The 1870 Magazine February 2019 sex survey of 1,232 Ohio State University students (56.8% women, 41.8% men, 0.01% non-binary, >0.01% transgender, 80.4% heterosexual, 10.7% bisexual, 4.5% gay)

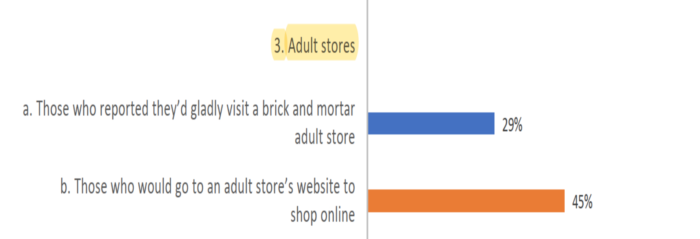
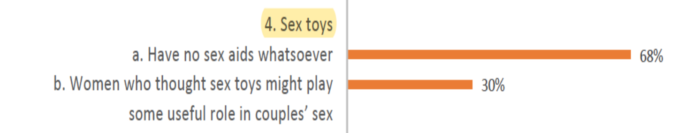
3. Stat #4 (of 6) from this study is the only section on Sex Toys: Britain – Women Over 40 & Sex: YOU magazine survey of 2,000 women over 40 conducted by ResearchNow and published on you.co.uk July 2018 (84% straight, 12% bisexual or bi-curious in some way, 4% acted on that curiosity and had some kind of same-sex encounter)
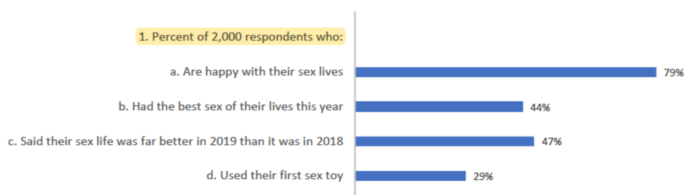
4. Stat #1 d. (of 2) from this study is the only section on Sex Toys: 2019 Pure Romance Sex Survey: A 2019 survey of 2,000 sexually active American adults (no gender/sex specified) commissioned by Pure Romance and conducted by OnePoll
5. Stat #3 (of 5) from this study is the only section on Sex Toys: Sex Trends for 2020: “Sex and the State of the Union” December 2019 survey of 1,000 U.S. adults by Lovers Family of Stores